The charting desk and journal for traders who measure
Build an edge you can prove.
Risk Lab is where traders become systematic. Find the setup on the live tape, test it in plain language, take it with a plan, and measure every trade on real candles until you know, in numbers, what makes you money.
What members say
“Before trying this platform I failed multiple times to journal my trades as I didn't think it would make a difference. Damn I was wrong. Just by using the basic tools in this platform, you are actually going through the grind and you know straight away if the trades you have been taking actually mean something (ie. difference between gambling and having an edge). The way this platform interacts with your trades as you journal them makes it a non brainer to use and if you are serious about trading you should get your money back in no time. That been said, I still haven't even explored the most advance tools in this platform.”
“Journaling has never been one of my strengths. I suspect many traders are in the same position: they either track data that provides little real value, never review what they record, or avoid journaling altogether. This tool removes that problem completely. Every trade is laid bare, making it easy to see exactly what went wrong, what went right, and which patterns keep repeating. It is the kind of tool you do not realize you need until you have used it. Even at $1,000 per month, the value it can return through better decisions, fewer repeated mistakes, and improved discipline would be difficult to overstate. I genuinely believe Lucky has created something beyond a trading tool. He has created clarity, accountability, and, most importantly, hope. It is that good.”
“Going over previous trades, I have realized that my best performance and sustained consistency came only during the times when I was very serious about tracking my trades. Over the years, I have tried multiple approaches to cataloguing and journaling my trades: personal discord, notion, excel sheets, expensive paid services, even writing them down by hand. Each approach had something that the other didn't, each was lacking. The Risk Lab has everything, and more. And it does so, because it was built by a professional trader with thousands of trades behind him, years of experience and an unparalleled dedication to his craft. More than that, it is also a forum for teaching, learning and helping each other improve as traders. You won't get that in an excel spreadsheet.”
“I am touching on the tip of the iceberg what they beast can do... the chart features itself trashes all charting software out there... I am glad to be here and having access to such a powerful thing... pls.. do yourself a favour by joining risklab before it becomes unavailable, god knows when.... Thank you LCA.”
“I’ve been using Risk Lab for a while now, and honestly it’s much better than TradingView. I can’t even compare the two. TradingView shows you a chart. Risk Lab lets you test your ideas, journal your trades, build playbooks and forward-test them, all in one place. There are a lot of options, and it’s a bit overwhelming at the start. My tip is to reserve an afternoon, click around and get used to things. It will change the way you trade.”
“Absolutely life changing for those who take the time to actually see what the platform has to offer. For those who don't... what are you even doing.”
“Mind boggling in regards to funcionality and potential”
“Lucky is one of the very few traders that has earnt the full attention of a aspiring trader - or seasoned trader looking to optimise his trading career. I have known him for over 2 years and there is no one who puts in more time and effort into his work than him. The RiskLab has everything you need to completely transform your trading game. As a seasoned trader the value given for the price is unbeatable. I would recommend this to anyone interested in trading - regardless of your experience and trading style.”
“The journal insights alone have been a game-changer for me, helping me characterize what kinds of trade setups I take and when, as well as how much potential profit I'm capturing from runners. The chart and lab have changed how I test strategies, since there's a wealth of back testing data and automated forward tests for both paper trading and with funds on an exchange. Members can create educational modules, playbooks that define what setups they'll take, plans for specific trades, and we can share them on a feed for all members, or in private groups. The community aspect is next-level and the traders here are great people. Connecting with them has been one of the best parts of the journey. Risk Lab is an awesome platform, highly recommend.”
“After I started using Risk Lab, I realized that this is truly a masterpiece created by a man who put his whole life experience into building an absolutely mind blowing set of tools. It almost feels like cheating, and I honestly believe this could be life changing for me in the near future. I’ve been following Lucky Chart Ape since the beginning of LATF (5 years) and I’ve always felt blessed to have found such an incredible mentor. After he created Risk Lab, I feel even more grateful and blessed. Thank you so much for giving us the opportunity to learn from you and for giving us the possibility to use such an incredible tool!”
“Sensational – the most complex and most underrated tool ever. It’s insane how much data you can gather just from your trading journal alone. If you check out the rest of the tools, it’ll blow your mind. I have to say, though, that it takes a bit of time to find your way around, but there’s an assistant that can guide you through pretty all. This IS probably the best trading tool for professionals, but it’s not just a tool or journal – it’s a whole system. It literally pushes you to optimise your trades and your strategy. Kudos to Lucky!”
“Institutional-level type of journaling, and I think this is what institutions are gatekeeping when it comes to this kind of journaling. Exceptional and top-level. I love it lol. ”
“All-in-one tool to plan, chart and journal your trades. Fantastic app.”
“I really don't know what's left to the traders to do, this tool gives you support and resistance / accumulation ranges and order flow important events and foot print reads and explains it like no one else. Super clean money printer, glad to be a part of the future of trading, could use some improvements to make the UI more clean and tidy but over all great stuff.”
“Crazy powerful platform. Still wrapping my head around all the bells and whistles but already mind blowing to think this is only V1.0”
Every review here was written by a paying member. Read them all
The chart
Find the setup on the tape. Prove it. Then let the chart watch for it.
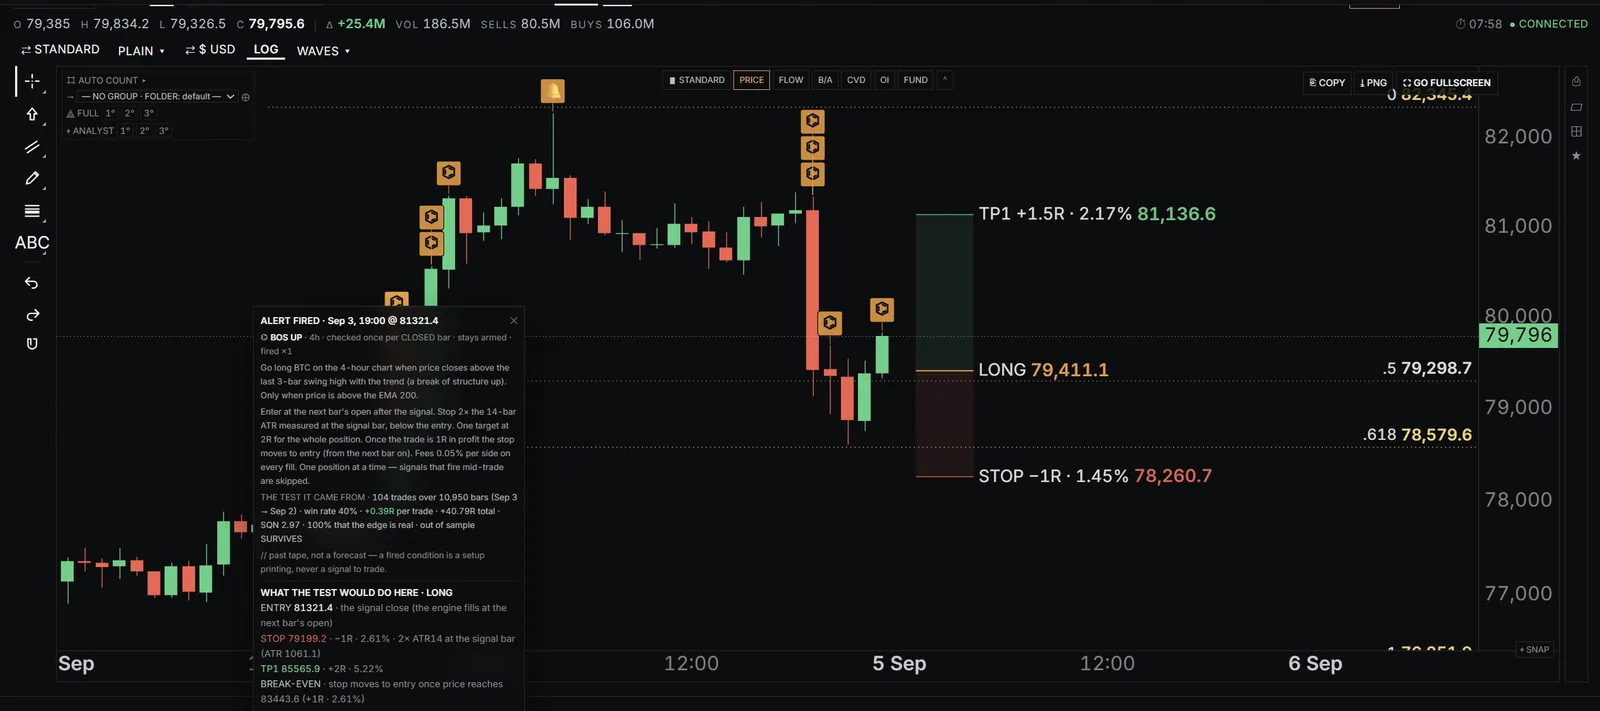
Most charting shows you lines. This one keeps score. Every level, fib and wave count the chart draws for you says what it did the last time, and any setup you can describe in a sentence can be tested over the tape and armed as an alert.
01
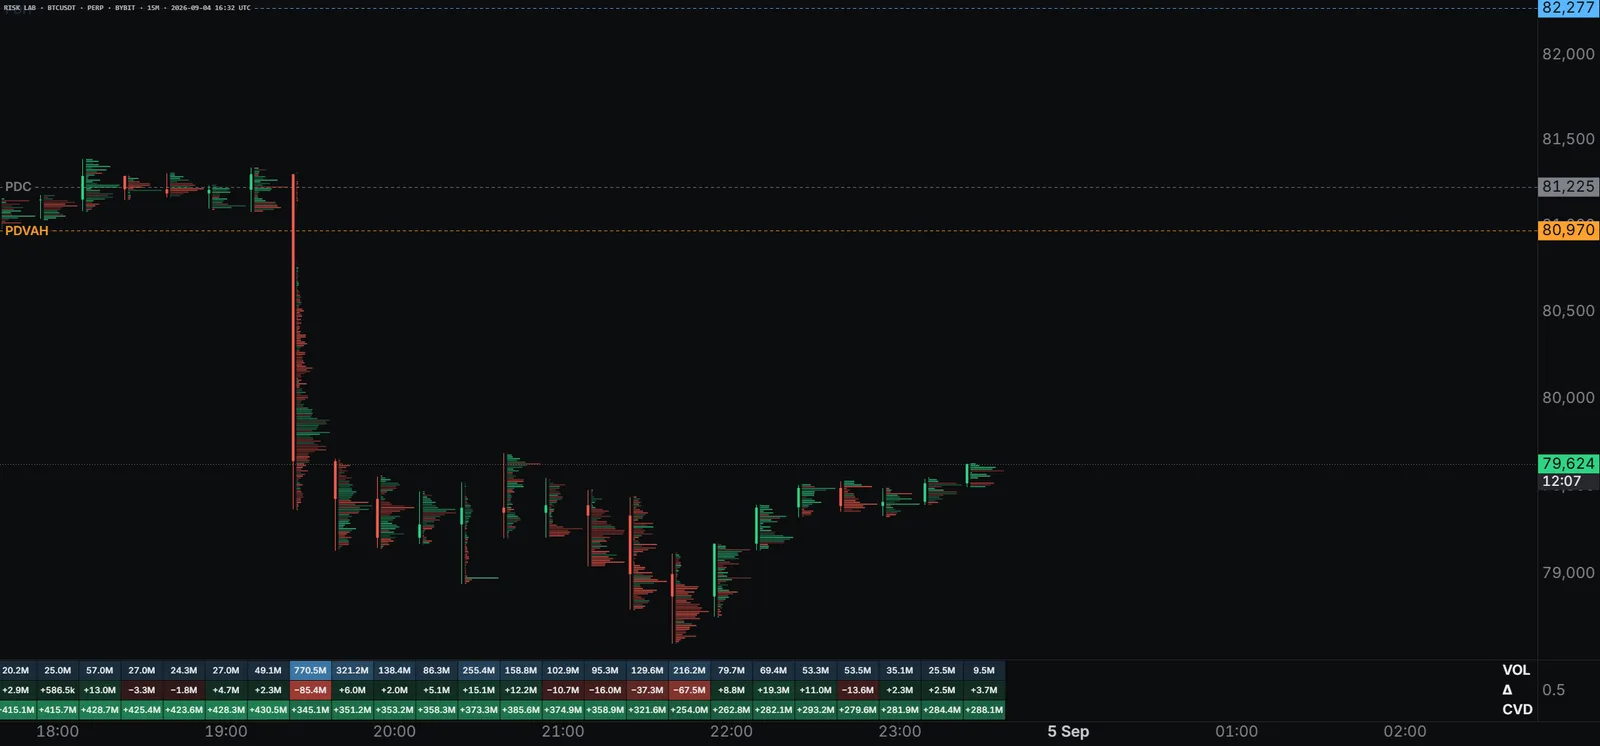
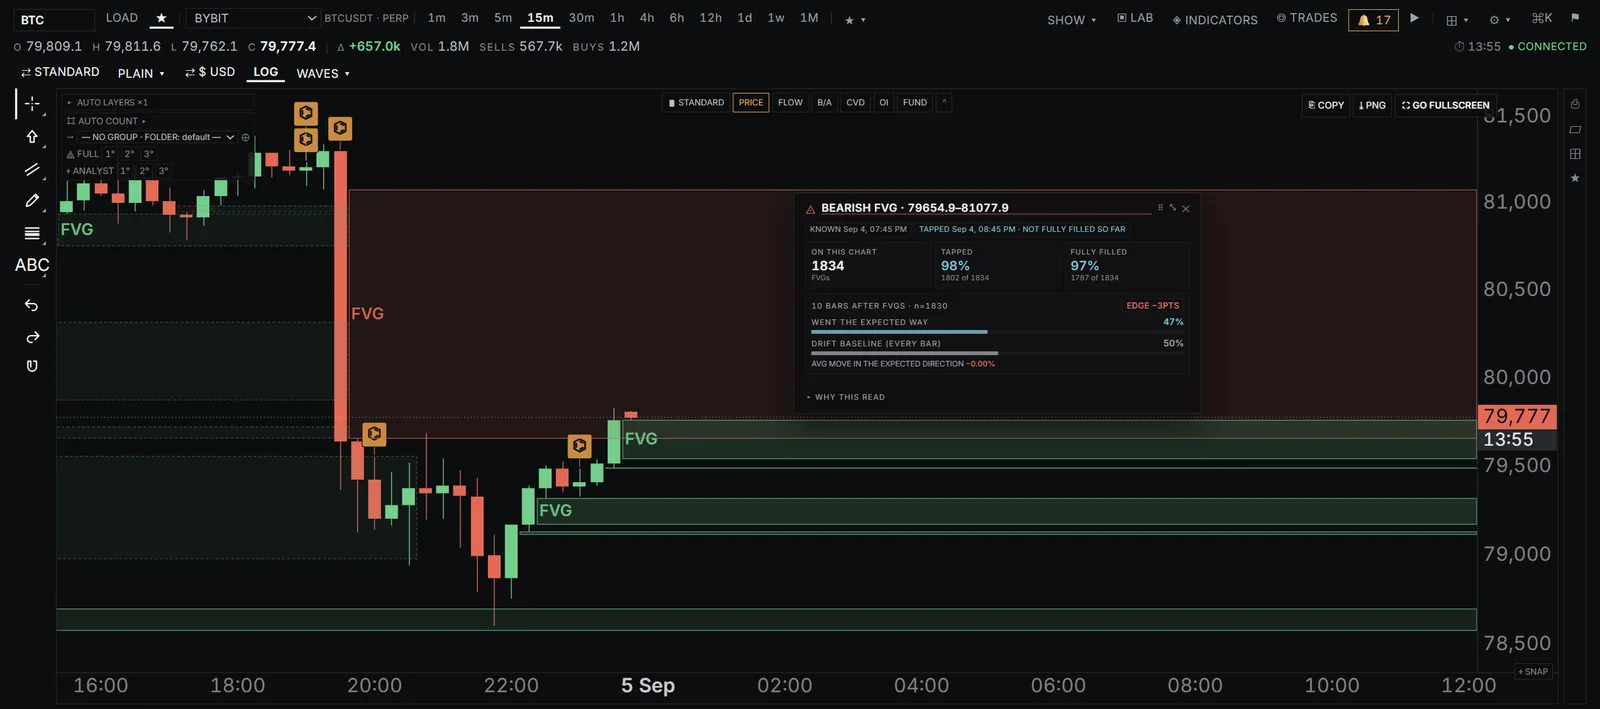
Levels that keep score
Auto fibs, auto trendlines, wave counts and fair-value gaps draw themselves as the tape develops, and each one carries its own record on this chart. Open the card on a gap and it tells you how often the last 1,834 gaps on this tape were tapped and filled, and what price did in the ten bars after. Nothing on the chart is decoration.
- Order flow the lab collects itself, around the clock: footprint, delta, CVD, open interest, liquidations and funding on more than a thousand markets.
- Volume profile by day, week, month or session, with point of control and value area as live levels.
- Your plans and trades on the same chart, so a level's history and your history sit side by side.
02
A backtest in plain language, with the full report
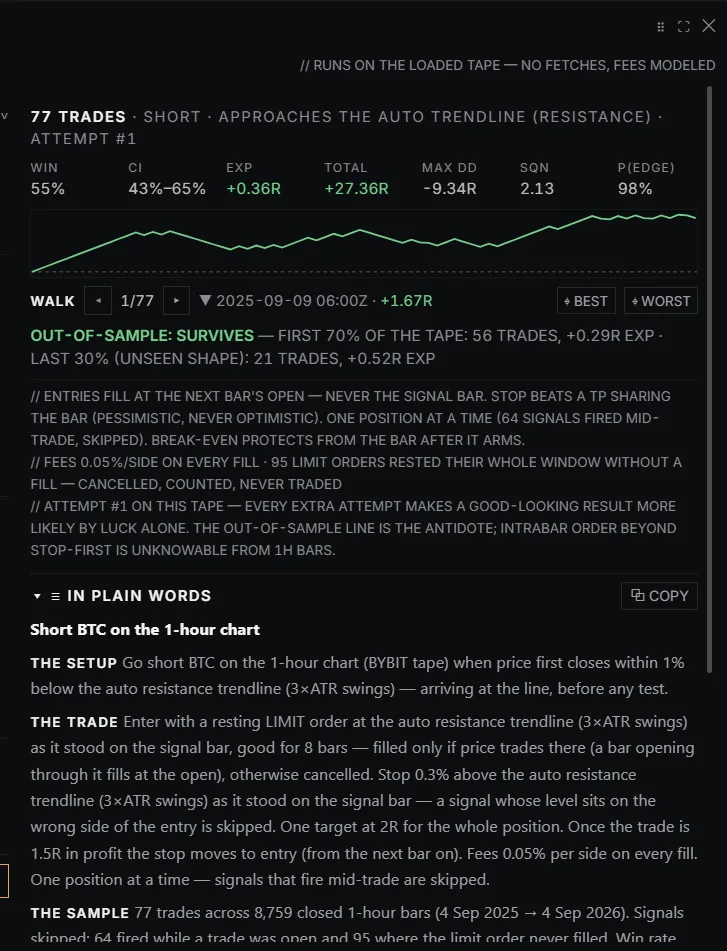
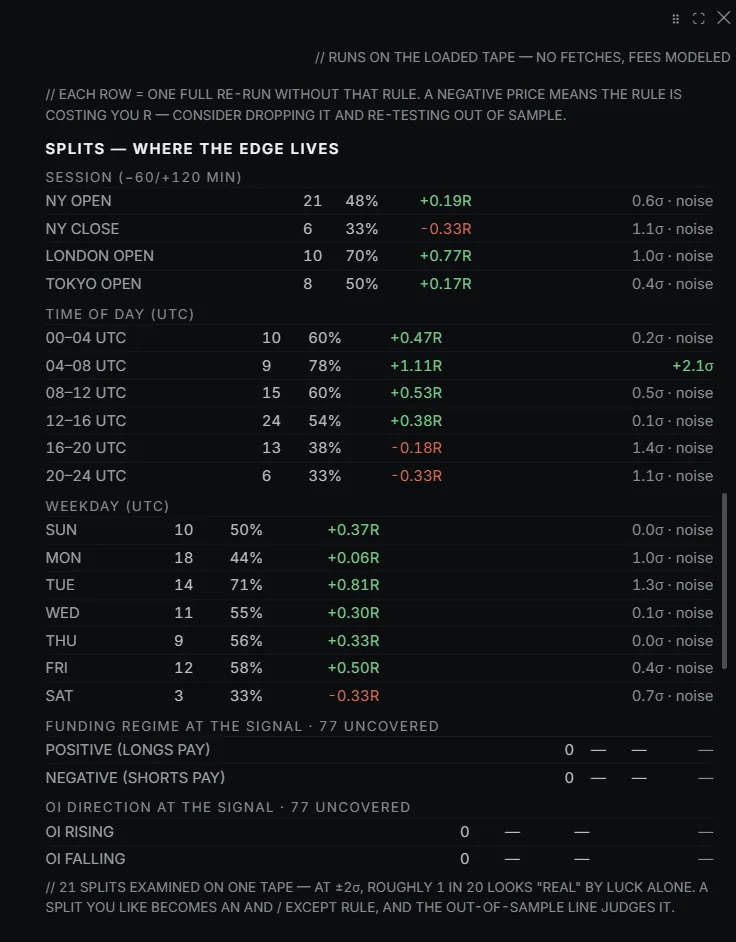
Open the Lab and describe the setup the way you would say it out loud: a close below the value-area low after a heavy selling bar, in the New York session, with a stop above the last swing. The Lab runs it over the chart's whole tape and hands you the report: signals, win rate, expectancy in R, the heat each signal took, the equity curve.
- Sweep a knob. Try every stop distance, every session, every target at once and see which setting is the edge and which was luck.
- Honest verdicts. Forty signals reads as forty signals. The report says when the sample is too small to trust.
- Save it, compare it, share it. Saved tests sit side by side, and a winning one becomes a playbook with its rules already written.
03
Get told every time it appears
Arm the winning test as an alert. From then on, every time that positive-expectancy setup shows up on the tape, the chart pings your phone, with the test's record attached so you know exactly what you are looking at before you open the chart.
- Alerts on anything: a drawn line, a level, an order-flow signal, a Lab test. Loud on the desk, push on the phone.
- File the plan from the alert. Entry, stop and target land in pre-flight, sized to your playbook's risk, in one tap.
- The alert's own track record grows as it fires, so you can see whether the setup is still working.
The journal side
Then every trade you take becomes evidence.
A journal remembers. A lab measures. Drop in your exchange export and every trade is normalized to R, walked on real candles, tagged into the setup it belongs to and read for the patterns you would never spot by hand.
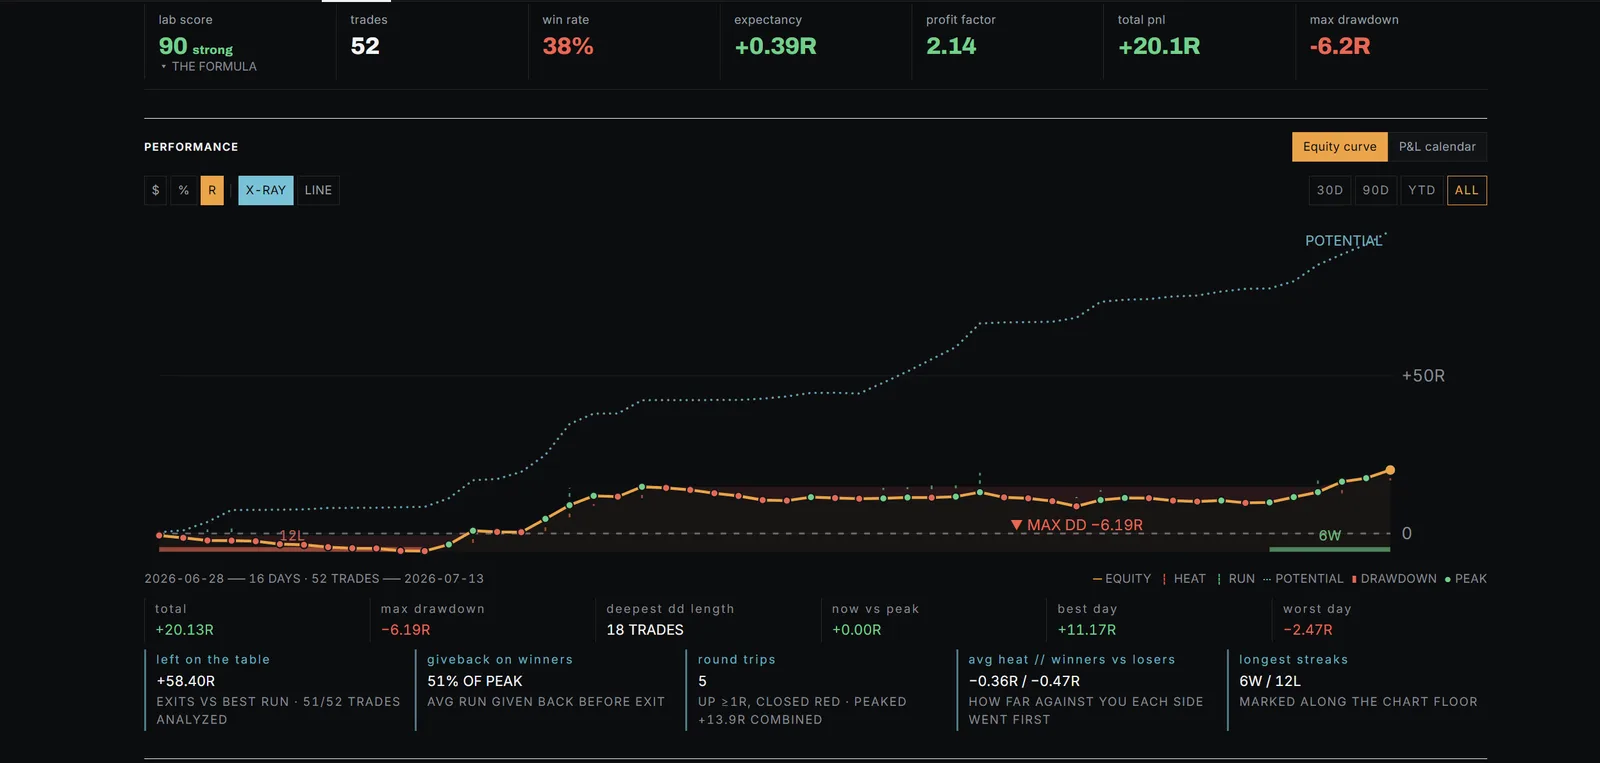
Heat & run
See inside every trade, not just its result.
A +1R winner that was down 0.9R first is a different trade from one that never went red. The journal knows the difference for every trade you have ever taken.
- Automatic. Every imported trade gets its heat (how far it went against you) and its run (how far it went for you, including after you closed) on the lab's own candle store.
- The X-RAY view draws what price offered beside what you took. The gap is what your exits leave on the table.
- Twenty formats on sight, and a column mapper for any other spreadsheet that never guesses a cell.
Playbooks and deep stats
Name your setups. Then find out which one is lying.
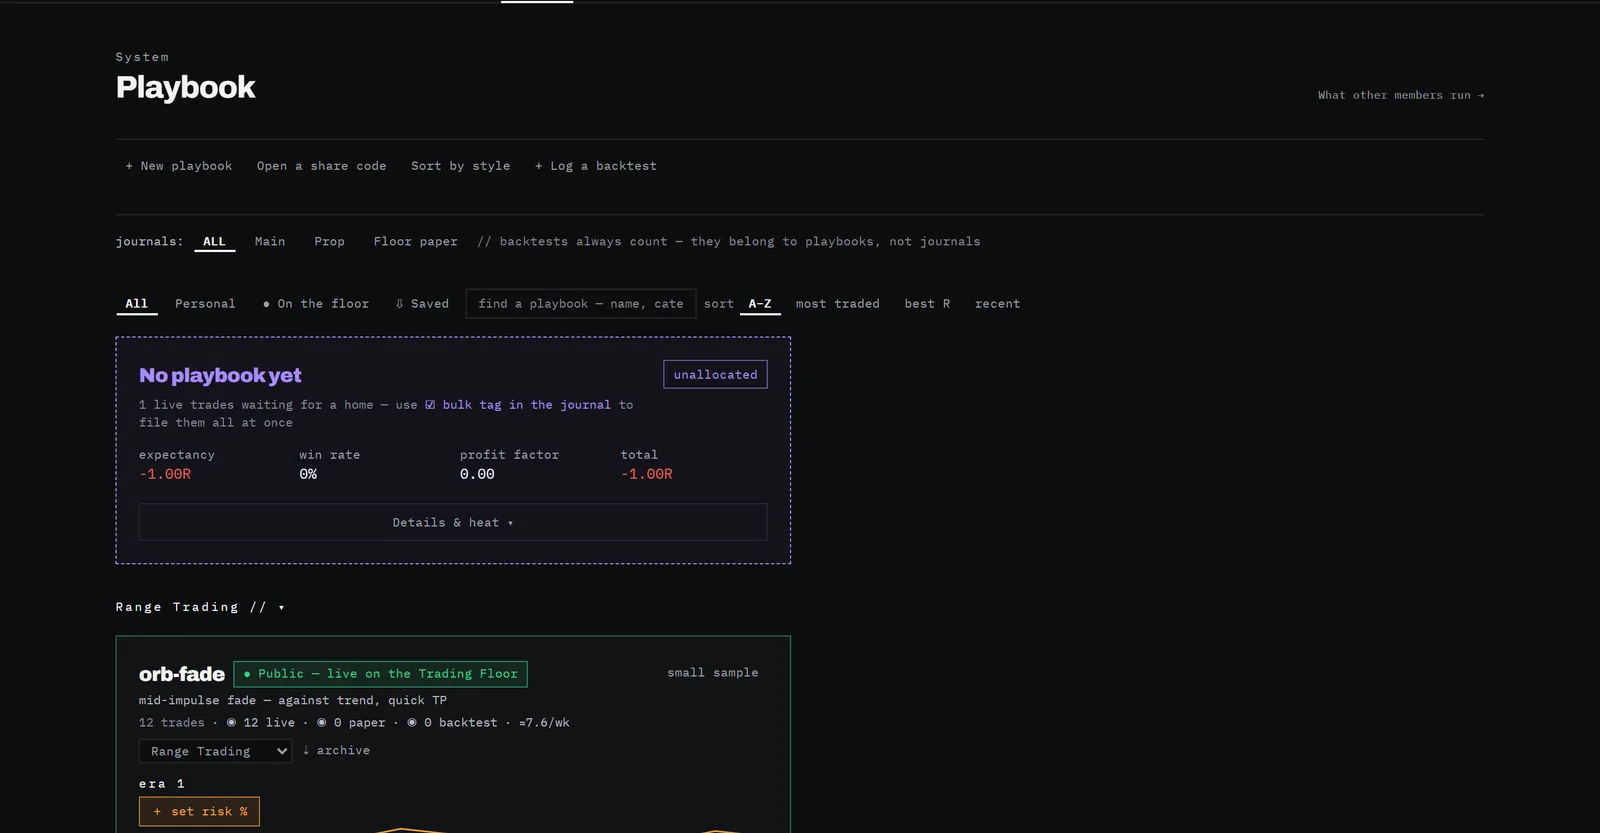
A “strategy” is usually three setups wearing one name, and one of them is quietly losing. Tag each trade into a playbook and the numbers separate them.
- Every setup gets its own card: expectancy, profit factor, and the probability the edge is real rather than luck.
- Deep stats builds any cohort (longs only, one symbol, one risk era, the New York open) and returns a verdict with a range, not a point.
- Risk eras. Change a playbook's risk and the history stays clean, comparable side by side.
Pre-flight and the arc
Plan it before. Get graded after.
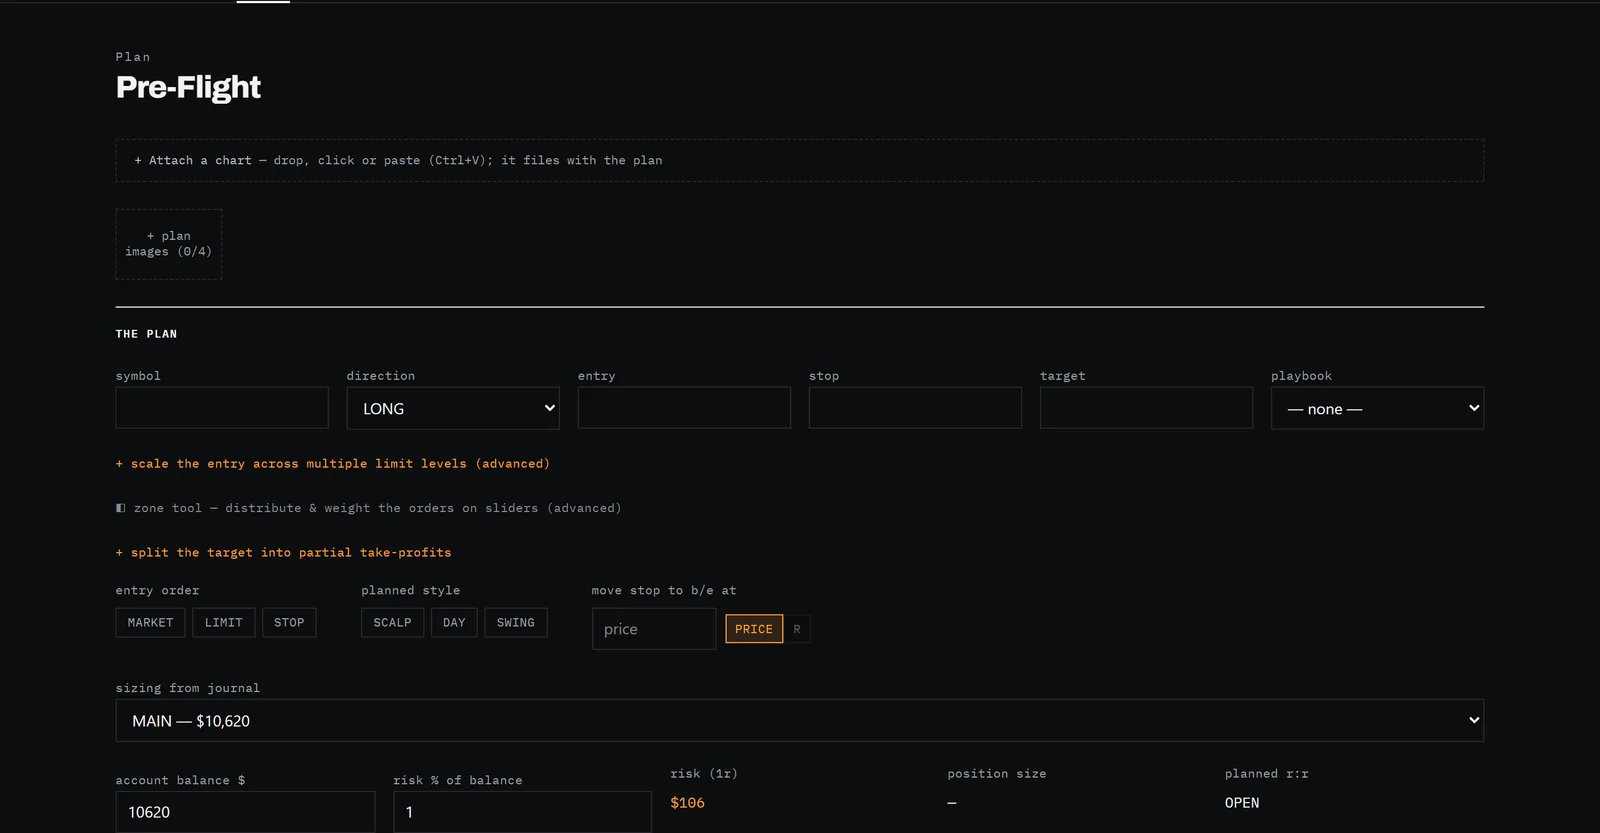
File entry, stop, target and your playbook's checklist before you click. When the fill lands in your journal, the plan links to it on its own.
- Every trade has two versions: what you planned and what you did. The gap is your execution quality, measured on every trade.
- State of mind, captured before. Calm, hesitant, fomo, revenge, with a conviction score, logged at filing so it can never be rewritten after.
- The arc keeps one page per plan: filing, revisions, fills, the moments you logged mid-trade, the aftermath.
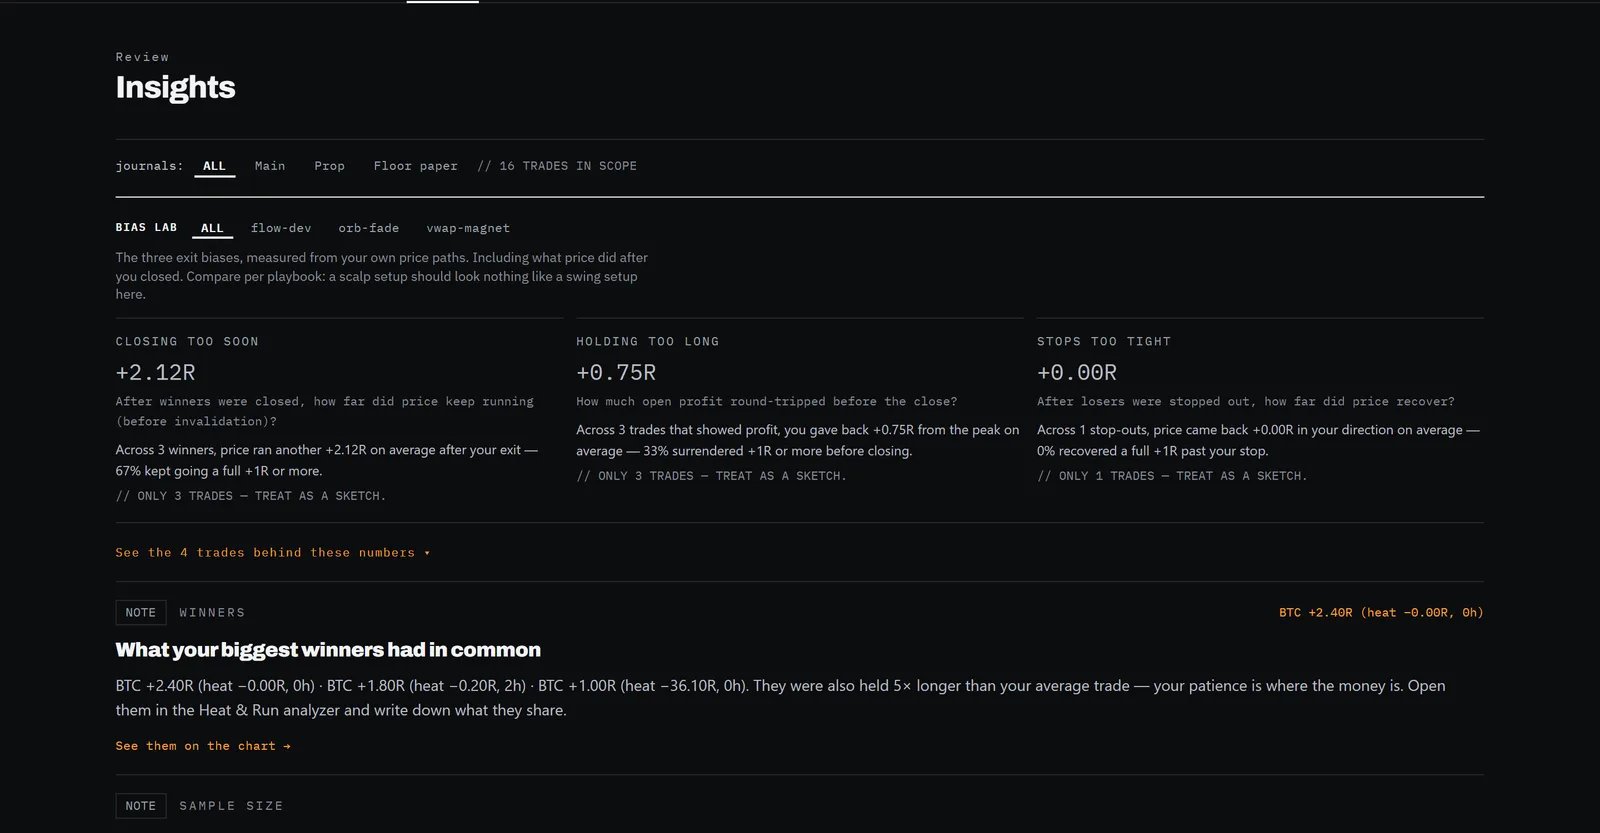
Key insights and the bias lab
The journal reads itself.
Sizing drift, exit efficiency, weekday leaks, revenge windows, the states of mind that cost you. Found across your whole record, not remembered from last week.
- Graded by evidence. A weak signal says so instead of dressing up.
- The bias lab measures round-tripping, tight stops and early exits from what price actually did after you were out.
- Per playbook, per feeling. Trades entered feeling fomo, on Tuesdays, after a loss: every slice you would want to ask about.
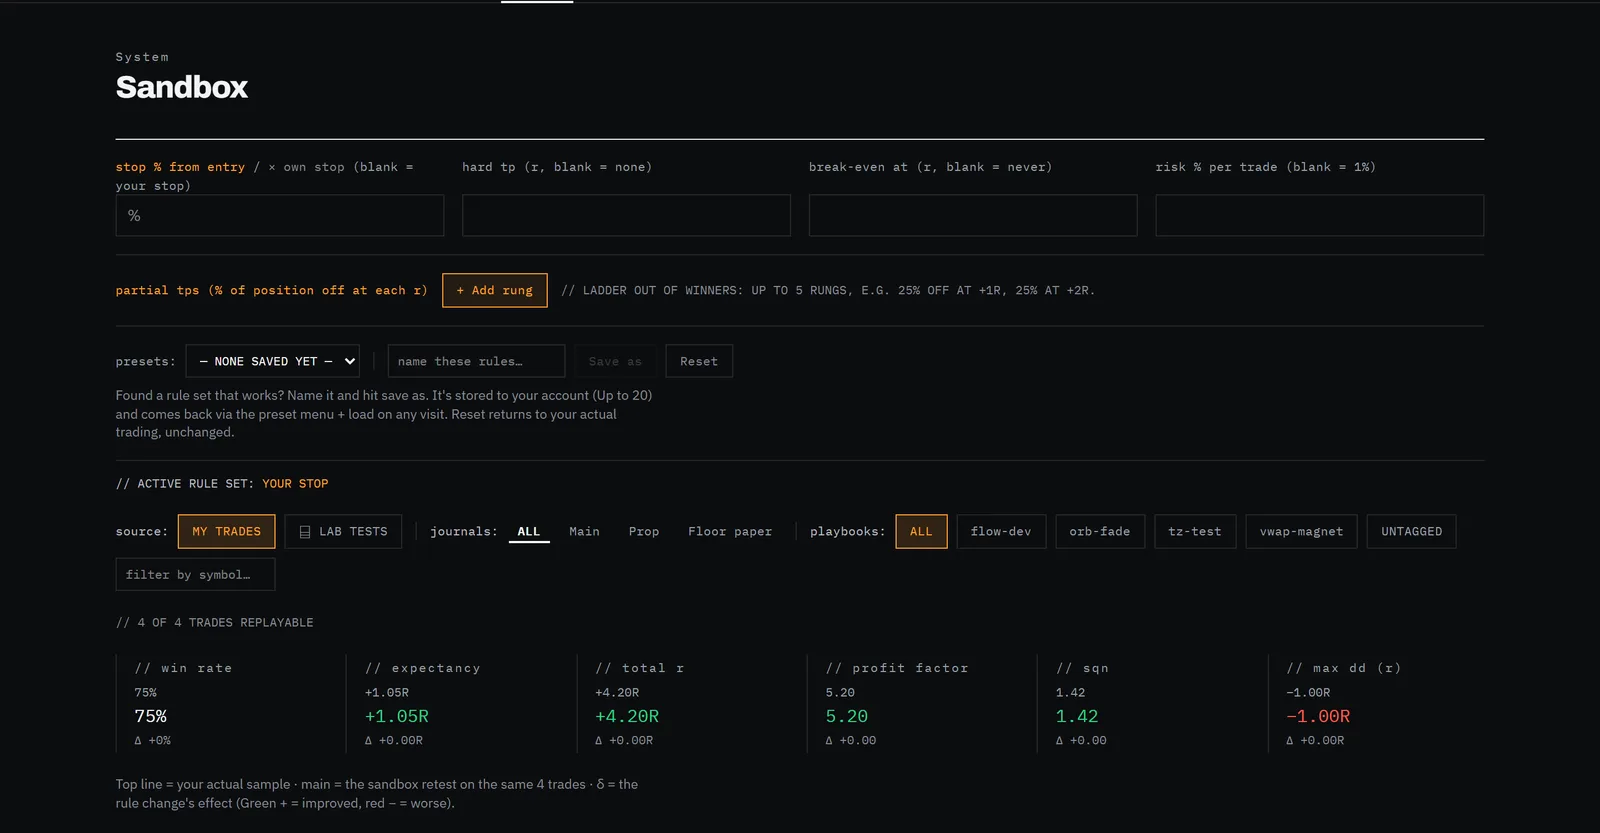
Sandbox and simulator
Your history, replayed under different rules.
Because every trade carries its heat and run, the sandbox can replay your whole record under a tighter stop, a hard target, a partial ladder or a break-even move.
- Three hands on identical candles: what you did, what your filed plan would have done mechanically, what the rule under test does.
- Should I trail my stop? Answered on your own price paths instead of a debate.
- A thousand futures. The simulator runs your measured edge forward so a five-loss streak is variance you have already seen. Free for every account.
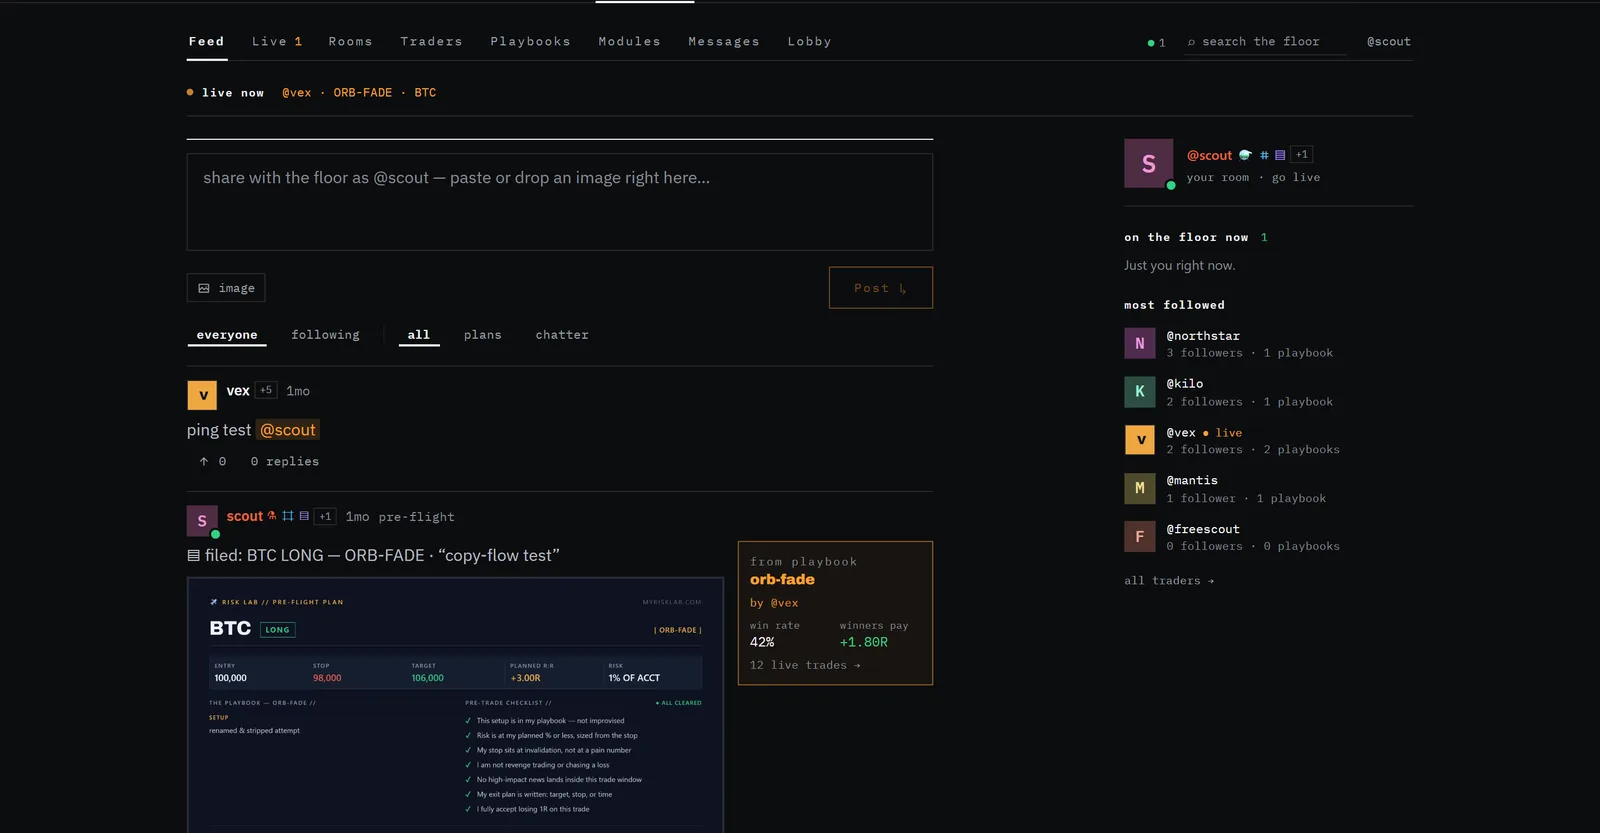
The Trading Floor
Put your playbook on the record.
Everything above works alone, forever, in private. The Floor is the optional layer on top, where playbooks, plans and live execution go on the record.
- Anonymous by construction. Floor names and R only. Dollars, balances and your email are never shown to anyone.
- Network evidence. As members copy a public setup and trade it, it builds pooled R across many hands. One sample can be luck. A network cannot.
- Live sessions. Watch execution thinking in real time, then the replay files to the playbook.
What the lab will not do
Measurement, never advice.
Most trading products sell certainty. The lab sells instruments. Three rules it never breaks:
- 01No signals, no trade calls.Nothing here tells you what to buy. It tells you what your own record and the tape say.
- 02No opaque scores.The Lab Score prints its formula in its own tooltip. Other platforms sell a number; the lab shows the math.
- 03Small samples say so.Every verdict carries a range and a count. “Not enough data yet” is an answer the lab is happy to give.
Also on the desk
The parts that make the rest easy.
Twenty formats on sight
Hyperliquid, Binance, Bybit, MEXC, Bitget, Bitunix, Blofin, KCEX, Lighter, GMX, Breakout, FTMO and MetaTrader, Tradovate, NinjaTrader, TradingView and more.
Hyperliquid wallet sync
Paste an address. No key, no login shared. Closed positions arrive chartable.
Up to five journals
Main, prop, paper. Paper stays classified apart from live. Playbooks are shared across all of them because everything speaks R.
The weekly report
Your week in R every Monday. Deterministic: just your numbers, no prose generator.
Scratch notes and a whiteboard
A pad on every page and a canvas for the thinking between trades.
The Lab Assistant
Answers from a fixed, reviewable manual. It sees none of your data. When the manual does not cover something, it says so.
On your phone
Installs as an app. The chart, the journal and quick trade logging have phone layouts, and alerts arrive as push.
Your data leaves cleanly
One-click CSV export that re-imports without loss. Never locked in.
Pricing
The journal is free. The lab is one membership.
Free account
$0 no card · no clock
The free journal on its own stands up to the paid journaling apps. What they charge a subscription for, this account includes.
- The full journal: every importer, the column mapper, wallet sync, up to five journals
- Heat and run computed on your trades, with the X-RAY view
- The simulator, your weekly report, scratch notes
- The Discord lobby and the Lab Assistant
Your data exports cleanly at any time. Nothing to cancel.
Membership
$119 per 30 days · pay as you go
Everything else the lab does has no equivalent anywhere: a chart that keeps score, a backtester you talk to, a journal that reads itself. One membership, no tiers, no add-ons.
- The chart with the live tape, auto levels, the Lab and alerts to your phone
- Playbooks, deep stats, key insights and the bias lab
- Pre-flight, the arc and the sandbox
- The Trading Floor: public playbooks, network evidence, live sessions
- The Discord member channels and lab points
Pay by USDC or USDT (Base or TRON). No auto-renew: each 30 days is a choice. Refer a member and take 25% off your next month; four referrals make it free.
Or subscribe with PayPal from the billing page: the same $119 every month, charged by PayPal, cancel any time.
Priced in R
About $3.97 a day. If the lab changes one exit, one stop or one skipped trade a month, you know what that was worth in R.
“Even at $1,000 per month, the value it can return through better decisions, fewer repeated mistakes, and improved discipline would be difficult to overstate.”
Questions
Before you import anything.
Which exchanges and prop firms does it read?
Twenty formats on sight, including Hyperliquid (file or wallet), Binance, Bybit, MEXC, Bitget, Bitunix, Blofin, KCEX, Lighter, GMX, Breakout, FTMO and MetaTrader statements, Tradovate, NinjaTrader and TradingView exports. Anything else goes through the column mapper, which reads your spreadsheet and never guesses a cell: unreadable rows are rejected and listed, not silently dropped.
What is R?
Profit divided by what you risked on that trade. Losing exactly your risk is −1R. Making twice your risk is +2R. It makes trades of different sizes comparable, and it is the only unit anyone on the Floor ever sees.
Is this trade advice?
No. The lab measures your own record and the tape and shows you the math. It never tells you what to buy or sell. Education only, not financial advice, and every number is a sample of the past, not a promise.
Who can see my trades?
You. Your journal is private by construction. The Floor is optional, runs under a floor name, and shows R only. Dollars, balances and your email are never shown to anyone.
Do I need a card to start?
No. The free account has no card, no trial clock and nothing to cancel. Membership is paid by crypto thirty days at a time, or as a PayPal subscription you can cancel any time.
What happens to my data if I leave?
Export it in one click. The CSV re-imports without loss, here or anywhere else.
Make your own luck
Start collecting your data.
Every trade you do not log is edge information thrown away. The import takes two minutes. Not sure yet? Create the account and flip on sample data: the whole lab fills with realistic demo trades so you can open every instrument before importing one of your own.